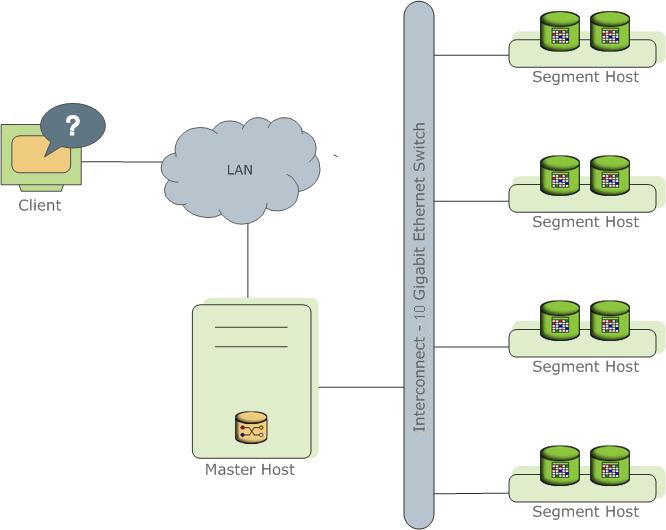
High-level overview of GPDB system architecture

GPDB:
- software-only solution
- Performance depends on the hardware on which it is installed
Master
- entry point
- accept client connections
- process the SQL commands that the system users issue
- maintains the system catalog, not contain any user data
- authenticate client connections
- process incoming SQL commands
- distribute the work load between segments
- coordinate the results returned by each segment
- present the final results to the client program
- need a fast, dedicated CPU for data loading, connection handling, and query planing
Standby
- keep up to date by a transaction log replication process
- only the system catalog tables need to be synchronized
Segment
- where data is stored and where most query processing occurs
- each segment contains a distinct portion of the data
- the number of segment instances per segment host is determined by the number of effective CPUs or CPU core.
- Performance testing will help decide the best number of segments for a chosen hardware platform.
- mirror: group mirroring (default) or spread mirroring
- GPDB performance will be as fast as the slowest segment server in the array.
- Note: one primary segment instance (or primary/mirror pair if using mirroring) per CPU core.
- each CPU is typically mapped to a logical disk.
- RAID
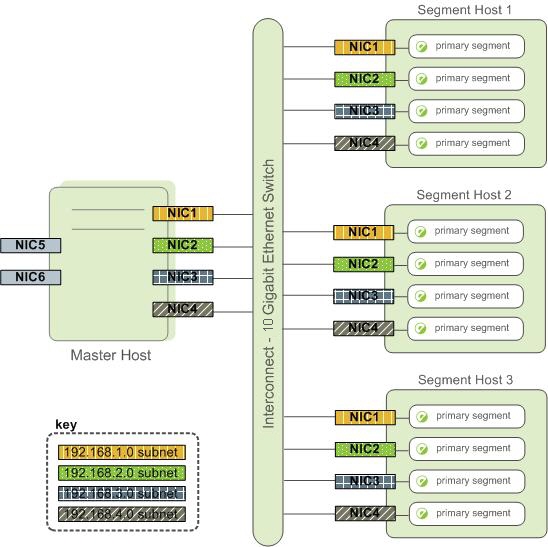
Interconnect
- the networking layer of GPDB
- use a standard 10 Gigabit Ethernet switching fabric
- use UDP (User Datagram Protocol) with flow control for interconnect traffic to send messages over the network
- GPDB does the additional packet verification and checking not performed by UDP,
- configuration parameter: gp_interconnect_type
- Example Network Interface Architecture:

ETL Hosts for Data Loading
- gpfdist
- speed: an average rate of about 350 MB/s for delimited text formatted files and 200 MB/s for CSV formatted files.
Greenplum Performance Monitoring
- GPDB includes a dedicated system monitoring and management database, named gpperfmon, that administrators can install and enable.
- be enabled, every 15 seconds, agent on each segment host collect query status and system metrics
- Greenplum Command Center